In this Signal Processing ToolKit post, we’ll look at the idea of signal representations. This is a branch of signal-processing mathematics that expresses one signal in terms of one or more signals drawn from a special set, such as the set of all sine waves, the set of harmonically related sine waves, a set of wavelets, a set of piecewise constant waveforms, etc.
Signal representations are a key component of understanding stationary-signal processing tools such as convolution and Fourier series and transforms. Since Fourier series and transforms are an integral part of CSP, signal representations are important for all our discussions at the CSP Blog.
Let’s call our signal of interest , and let us restrict our attention to the interval . A representation of is given by the weighted sum of elementary signals ,
where I’ve purposely left off the limits on the sum–it could be a finite sum or, more commonly, an infinite sum. The equality in (1) is sometimes exact, but more often we understand it to be equality in some weaker sense, such as at all points except those in some zero-measure set or the like. Not the kind of mathematical detail that I want to dwell on at the CSP Blog. Don’t want this to be the CSP Bog.
The signal representation is useful when you can learn something about the signal through its representation, or when you can use the representation to perform a signal-processing task, such as compression, transmission over a channel, noise rejection, etc.
So what are good choices for the elementary signals ?
Orthonormal Representations
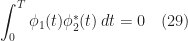
A desirable property of the set is that each distinct pair of functions is orthogonal:
where . When two functions are orthogonal, they don’t have anything in common, once you take into account the entire interval . This is similar to the notion of orthogonality in vector mechanics, where two vectors are orthogonal when their dot (inner) product is zero. That notion, in turn, generalizes our intuitive geometric notion of perpendicularity.
Why is orthogonality desirable? Suppose we have the representation (1),
and we want to know the value of, say, . If we multiply by and integrate, we get
If for all , then the elementary set of functions is an orthonormal set. In which case, we can find the coefficient of by integrating the product of that elementary function with the signal.
The discrete-time versions of these ideas and equations are straightforward–replace integrals with sums.
Representation with a Truncated Series
The idea of analyzing arbitrary signals into definite quantities of other, simpler, building-block signals is appealing, but we can’t help noticing the infinities involved in the equations presented so far in this post.
What happens when we want to represent an arbitrary signal using only a finite number of the basis functions? Which do we choose?
First, let’s look at the energy in a signal in terms of its representation. We have
The energy on the interval is given by
or
Let’s substitute (5) into (7) to yield
So the energy of on the interval is equal to the sum of the squared magnitudes of the basis-function components of . This is a form of Parseval’s relation, which says that the energy in a signal is equal to the energy in a transform of the signal.
Armed with this new fact, let’s look at a truncated series representation for . We have
where is smaller than the number of functions in the basis set. That is, if the number of the is infinite, then is finite, and if the number of functions is , then .
What should we choose for the ? Is the best choice? Is it even a good choice? Does that depend on the particular kinds of functions making up the basis set ?
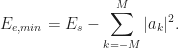
One way to determine a good choice for the is to choose them so as to minimize the error between the signal (equivalently, its representation) and the approximation (the truncated series). But what error measure do we use? Well, let’s use one that we have encountered in other areas of signal processing and statistics, and that is mathematically friendly: the squared error. In particular, let’s try to minimize the energy in the direct error:
The error energy is
which we can express as
By expanding this expression, we get to
Let’s add zero to the sum for each . In particular, add to each term:
Simplifying (17) leads to
and we see that only the last term depends on the coefficients. That term is never negative, so that the smallest it can be is zero. Therefore, the minimum error energy corresponds to the choice
and that minimum error is
The best coefficients to use in the truncation (approximation) are those used in the representation.
So we know how to manipulate signal representations, and we know how to specify finite-term approximations to infinite-series representations. We know how to compute a particular coefficient , and we know the value of orthonormal representations. Given all that, how do we pick the particular basis functions ?
The application of interest drives the nature of , and this will give hints as to good choices for the . By far the most commonly used set of basis functions is the set of harmonically related sine waves. That choice leads to the Fourier series and the Fourier transform. But some others are of interest too, and simpler, so let’s look at them first.
The Impulse Functions
Let’s consider some function of time that is reasonably smooth, such as the one in Figure 1. To start our development of an impulse-function representation, let’s consider approximating this function by a set of shifted and scaled rectangle functions.
Figure 1. A smoothly varying function of time.
The width of each rectangle is , and the center points of the rectangles are at the time values , as shown in Figure 2.
Figure 2. One way to approximate the smoothly varying function in Figure 1 by using elementary building-block waveforms such as rectangles.
It might be obvious to you that the approximation gets better as decreases. Let’s consider some finite interval of time, say over which to perform this approximation, meaning that for any finite , there will be a finite number of rectangles needed for the approximation, say We can write the approximation in mathematical terms by introducing the rect() function,
Using (20), the function is a rectangle with width centered at . Our approximation is then given by the formula
Let’s multiply each term in the sum by . This yields the approximation
The rectangles in the second set of brackets have width and height . As decreases, the rectangles get narrower, but also get taller. Their area is always unity though.
Figure 3. Various unit-area rectangles. When the width shrinks to zero, the rectangle becomes the impulse function.
When we let the width approach zero, the height becomes unbounded, and the resulting function is called an impulse or the delta function. It is typically denoted by the symbol :
Returning to (22), we see that several things happen as we let approach zero. First, the unit-area rectangle functions become delta functions. Second, the number of rectangles becomes infinite. Third, the variable becomes the differential , and the variable becomes the continuous variable , and ranges over the entire interval . Combining these ideas leads to the impulse representation of ,
To represent the entire signal, we let increase without bound,
The meaning of (25) is that the signal is composed of an infinite number of shifted impulse functions, with strengths and locations .
We’ll use this continuous-time impulse-function representation later in the Signal Processing ToolKit posts. We’ll also make use of its discrete-time version.
The continuous-time impulse, , is a tricky mathematical object because it is not a function as we usually define a function, but is instead a generalized function. The trickiness comes in because we typically try to use this generalized function in situations involving otherwise completely well-behaved normal functions (signals). For an illuminating and accessible discussion of this trickiness of generalized functions, and the impulse in particular, see my review of a paper by Candan.
The Walsh Basis Functions
Let’s now turn to a more practical and concrete signal representation: The Walsh functions. These are simple binary-valued piecewise-constant functions on some finite interval. For (my) convenience, let’s now consider the interval instead of or .
Binary-valued just means that the Walsh functions can take on one of two values for any instant of time, let’s say and . Piecewise-constant means that the derivative of each Walsh function is zero everywhere it exists, and it exists at almost all instants of time. The places where the derivative doesn’t exist are those instants where the Walsh function transitions from to or from to .
The simplest binary-valued piecewise-constant function on is just the constant :
For orthonormal representations, we need the energy of the basis functions to be equal to unity, which forces (why?). But let’s keep using the ‘A’ notation for ease of reading and typing.
There is no unique way to define . We know that it must be orthogonal to (and all other Walsh functions of course), have unit energy, and be binary-valued and piecewise-constant. You can probably envision the inner product (2) of any relatively simple with since the latter is constant–for the inner product integral (2) to equal zero we’ll need to be equal to on subintervals whose lengths sum to half the interval and equal to on the other subintervals. So a straightforward choice is simply two subintervals:
Figure 4. Illustration of the first two Walsh basis functions. The zeroth function is simply a constant A on the interval [0, T], and the second is A on half the interval and -A on the other half. A is equal to the reciprocal of the square root of T, so that both functions have unit energy and it is simple to verify that they are orthogonal.Let’s move on to the choice for . After that, a general pattern will emerge and we can specify an infinite number of orthogonal Walsh functions with a simple recursive algorithm. The third Walsh basis function must satisfy the following three equations:
From (27) we know that , like , must be equal to on a number of subintervals whose lengths sum to and equal to on the remainder of the subintervals, whose lengths also sum to . From (28), must take on two values on the interval , else it will be identical to or its negative, and therefore it will not be orthogonal to . Again, the choice is not unique, but let’s stay with the notion of splitting the intervals in half, like we did to obtain from . This leads to the following choices:
Figure 5. Various choices for the third Walsh function. Each is orthogonal to the first two chosen Walsh functions, but they are not all orthogonal to each other.
Perhaps is most appealing because it just replicates twice in succession. If we add that function to our growing list of Walsh building-block functions, we can also add , because it is orthogonal to and is orthogonal to and .
was created by contracting so if fits in , then copying that to the interval , and finally negating the function on . is created the same way except omit the negation.
This leads to a general pattern of creating Walsh functions using previously selected Walsh functions: Shrink, replicate and shift, negate. And shrink, replicate and shift, no negation. So for each previously computed Walsh function we get two more after each iteration of this function-generation algorithm. Let’s call by the name and by the name .
Let’s continue with an example to make it perfectly clear how to obtain the coefficients in the Walsh representation. Our signal will be on the interval . Each representation coefficient is the integrated product of the signal and the corresponding function ,
Let’s compute the first several coefficients.
or
When , . Does that match your intuition about ‘how much’ of the ramp is a constant?
Continuing…
or
Computing and is more tedious, and leads to
Now let’s verify this analysis using a few numerical examples.
Walsh Examples
Since we computed the coefficients for a simple ramp function above, let’s start there,
Let’s set and consider various numbers of Walsh functions. We plot the signal, the Walsh approximation using basis functions, and the values of the Walsh-function coefficients in the following movie:
And, just for fun, here are three more examples: a sine wave, a sine wave plus an exponential, and random Gaussian noise:
Here are visualizations of various numbers of Walsh functions:
Harmonically Related Sine Waves
The most common and most useful set of building-block signal-representation functions are the harmonically related sine waves
where ranges over all the integers and is the length of the interval over which we represent a signal, as usual. You can check that any two such sine waves are orthogonal and that each one has energy equal to . This representation is known as the Fourier series representation.
We’ll go over how to derive the Fourier-series basis functions using our general representation machinery in the next Signal Processing ToolKit post. We’ll also look at various examples of Fourier series, and preview how the Fourier series leads to the Fourier transform.
The Significance of Representations in CSP
The key functions, or probabilistic parameters, in CSP are things like the time-varying autocorrelation and time-varying temporal moments and cumulants. These functions of time are, well, signals themselves, and so they can be usefully represented in terms of weighted sums of simpler signals such as sine waves. This will become more clear once we study a particularly useful and relevant representation: The Fourier series.
I'm a signal processing researcher specializing in cyclostationary signal processing (CSP) for communication signals. I hope to use this blog to help others with their cyclo-projects and to learn more about how CSP is being used and extended worldwide.
View all posts by Chad Spooner
4 thoughts on “SPTK: Signal Representations”
Seems to be a problem with what should be equation 20 (right after equation 19, showing the minimum error). Typo in setting up or closing the equation environment? I just see raw LaTeX…


![[0, T]](https://s0.wp.com/latex.php?latex=%5B0%2C+T%5D&bg=ffffff&fg=1a1a1a&s=0&c=20201002)


![\displaystyle s(t) = \sum_k a_k \phi_k(t) \ \ \ t\in [t_1, t_2] \hfill (5)](https://s0.wp.com/latex.php?latex=%5Cdisplaystyle+s%28t%29+%3D+%5Csum_k+a_k+%5Cphi_k%28t%29+%5C+%5C+%5C%C2%A0+t%5Cin+%5Bt_1%2C+t_2%5D+%5Chfill+%285%29&bg=ffffff&fg=1a1a1a&s=0&c=20201002)
![t \in [t_1, t_2]](https://s0.wp.com/latex.php?latex=t+%5Cin+%5Bt_1%2C+t_2%5D&bg=ffffff&fg=1a1a1a&s=0&c=20201002)


![\displaystyle E_s = \int_{t_1}^{t_2} s(t) \left[ \sum_k a_k \phi_k(t) \right]^* \, dt \hfill (8)](https://s0.wp.com/latex.php?latex=%5Cdisplaystyle+E_s+%3D+%5Cint_%7Bt_1%7D%5E%7Bt_2%7D+s%28t%29+%5Cleft%5B+%5Csum_k+a_k+%5Cphi_k%28t%29+%5Cright%5D%5E%2A+%5C%2C+dt+%5Chfill+%288%29&bg=ffffff&fg=1a1a1a&s=0&c=20201002)


![[t_1, t_2]](https://s0.wp.com/latex.php?latex=%5Bt_1%2C+t_2%5D&bg=ffffff&fg=1a1a1a&s=0&c=20201002)


![\displaystyle = E_s + \sum_{k=-M}^M \left[ |\hat{a}_k|^2 - \hat{a}_k^* a_k - \hat{a}_k a_k^* \right] \hfill (16)](https://s0.wp.com/latex.php?latex=%5Cdisplaystyle+%3D+E_s+%2B+%5Csum_%7Bk%3D-M%7D%5EM+%5Cleft%5B+%7C%5Chat%7Ba%7D_k%7C%5E2+-+%5Chat%7Ba%7D_k%5E%2A+a_k+-+%5Chat%7Ba%7D_k+a_k%5E%2A+%5Cright%5D+%5Chfill+%2816%29&bg=ffffff&fg=1a1a1a&s=0&c=20201002)


![\displaystyle E_e = E_s + \sum_{k=-M}^M \left( \left[ |\hat{a}_k|^2 - \hat{a}_k^* a_k - \hat{a}_k a_k^* + |a_k|^2\right] + |a_k|^2 \right) \hfill (17)](https://s0.wp.com/latex.php?latex=%5Cdisplaystyle+E_e+%3D+E_s+%2B+%5Csum_%7Bk%3D-M%7D%5EM+%5Cleft%28+%5Cleft%5B+%7C%5Chat%7Ba%7D_k%7C%5E2+-+%5Chat%7Ba%7D_k%5E%2A+a_k+-+%5Chat%7Ba%7D_k+a_k%5E%2A+%2B+%7Ca_k%7C%5E2%5Cright%5D+%2B+%7Ca_k%7C%5E2+%5Cright%29+%5Chfill+%2817%29&bg=ffffff&fg=1a1a1a&s=0&c=20201002)


![[-T, T]](https://s0.wp.com/latex.php?latex=%5B-T%2C+T%5D&bg=ffffff&fg=1a1a1a&s=0&c=20201002)


![\displaystyle \underbrace{s(t)}_{Signal} \approx \underbrace{\hat{s}(t)}_{Approx} = \sum_{k=-K}^K \underbrace{s(k\Delta t)}_{\substack{Height\ of \\ Rectangle}} \underbrace{\mbox{\rm rect}((t-k\Delta t)/\Delta t)}_{\substack{Width\ and \\ Location\ of \\ Rectangle}}, \ \ t \in [-T, T] \hfill (21)](https://s0.wp.com/latex.php?latex=%5Cdisplaystyle+%5Cunderbrace%7Bs%28t%29%7D_%7BSignal%7D+%5Capprox+%5Cunderbrace%7B%5Chat%7Bs%7D%28t%29%7D_%7BApprox%7D+%3D+%5Csum_%7Bk%3D-K%7D%5EK+%5Cunderbrace%7Bs%28k%5CDelta+t%29%7D_%7B%5Csubstack%7BHeight%5C+of+%5C%5C+Rectangle%7D%7D%C2%A0+%5Cunderbrace%7B%5Cmbox%7B%5Crm+rect%7D%28%28t-k%5CDelta+t%29%2F%5CDelta+t%29%7D_%7B%5Csubstack%7BWidth%5C+and+%5C%5C+Location%5C+of+%5C%5C+Rectangle%7D%7D%2C+%5C+%5C+t+%5Cin+%5B-T%2C+T%5D+%5Chfill+%2821%29&bg=ffffff&fg=1a1a1a&s=0&c=20201002)

![\displaystyle \hat{s}(t) = \sum_{k=-K}^K \left[ s(k\Delta t) \right] \left[ \frac{\mbox{\rm rect}((t-k\Delta t)/\Delta t)}{\Delta t} \right] \left[ \Delta t \right], \ \ \ t \in [-T, T] \hfill (22)](https://s0.wp.com/latex.php?latex=%5Cdisplaystyle+%5Chat%7Bs%7D%28t%29+%3D+%5Csum_%7Bk%3D-K%7D%5EK+%5Cleft%5B+s%28k%5CDelta+t%29+%5Cright%5D+%5Cleft%5B+%5Cfrac%7B%5Cmbox%7B%5Crm+rect%7D%28%28t-k%5CDelta+t%29%2F%5CDelta+t%29%7D%7B%5CDelta+t%7D+%5Cright%5D+%5Cleft%5B+%5CDelta+t+%5Cright%5D%2C+%5C+%5C+%5C+t+%5Cin+%5B-T%2C+T%5D+%5Chfill+%2822%29&bg=ffffff&fg=1a1a1a&s=0&c=20201002)


![\displaystyle s(t) = \int_{-T}^T s(u) \delta(t-u)\, du, \ \ t \in [-T, T] \hfill (24)](https://s0.wp.com/latex.php?latex=%5Cdisplaystyle+s%28t%29+%3D+%5Cint_%7B-T%7D%5ET+s%28u%29+%5Cdelta%28t-u%29%5C%2C+du%2C+%5C+%5C+t+%5Cin+%5B-T%2C+T%5D+%5Chfill+%2824%29&bg=ffffff&fg=1a1a1a&s=0&c=20201002)


![t \in [0, T]](https://s0.wp.com/latex.php?latex=t+%5Cin+%5B0%2C+T%5D&bg=ffffff&fg=1a1a1a&s=0&c=20201002)


![[0, T/2]](https://s0.wp.com/latex.php?latex=%5B0%2C+T%2F2%5D&bg=ffffff&fg=1a1a1a&s=0&c=20201002)


![[T/2, T]](https://s0.wp.com/latex.php?latex=%5BT%2F2%2C+T%5D&bg=ffffff&fg=1a1a1a&s=0&c=20201002)


![s(t) = t, \ \ \ \ t \in [0, T] \hfill (38)](https://s0.wp.com/latex.php?latex=s%28t%29+%3D+t%2C+%5C+%5C+%5C+%5C+t+%5Cin+%5B0%2C+T%5D+%5Chfill+%2838%29&bg=ffffff&fg=1a1a1a&s=0&c=20201002)


Seems to be a problem with what should be equation 20 (right after equation 19, showing the minimum error). Typo in setting up or closing the equation environment? I just see raw LaTeX…
More raw LaTeX in the section on Impulse Functions:
“It might be obvious to you that the approximation gets better as $\Delta t$ decreases.”
Clint: Right, thanks. I now see multiple raw latex errors. I must not have done the corresponding search that reveals them! Stay tuned a few minutes…
Fixed the ones I found. Let me know if you see other errors. I’d better go check the other SPTK posts… Thanks again! Very very helpful comments.